 Zellbase
Analysis
What lies behind every session.
Zellbase analyses every session with established heart rate variability methods and follows oxygen and pulse throughout. The result is not a wall of numbers but a description you can talk through with your client.
Summary
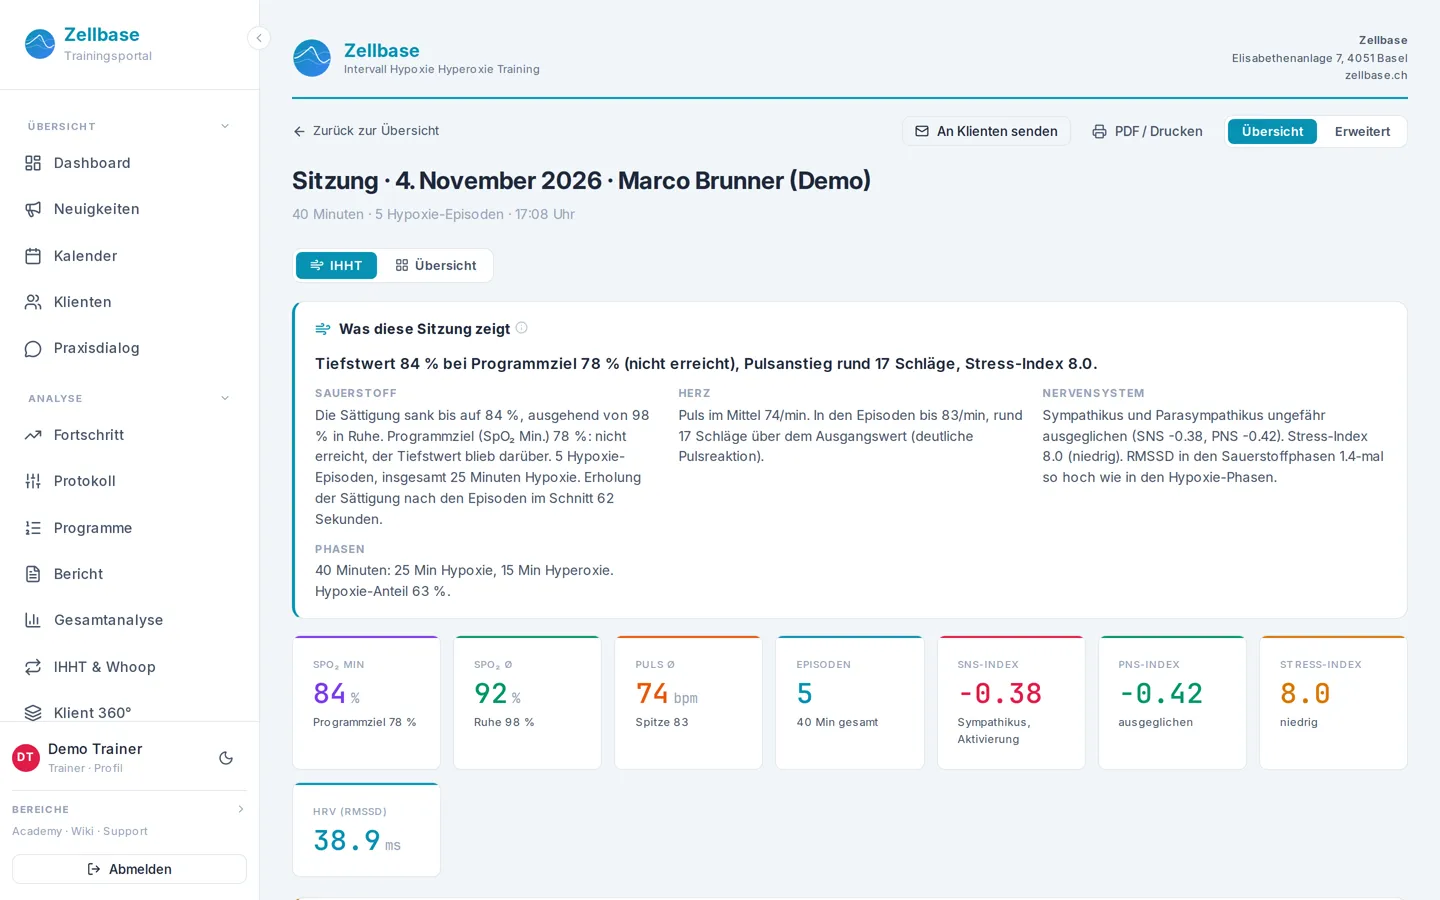
The sentence first, then the number.
For every session Zellbase describes in a few sentences how low the saturation went, how the pulse responded, how the nervous system followed and how the phases ran. The figures are below for anyone who wants to look deeper.
The description stays with what the measurement shows. It makes no diagnosis and does not judge whether a session was good or bad.
Oxygen
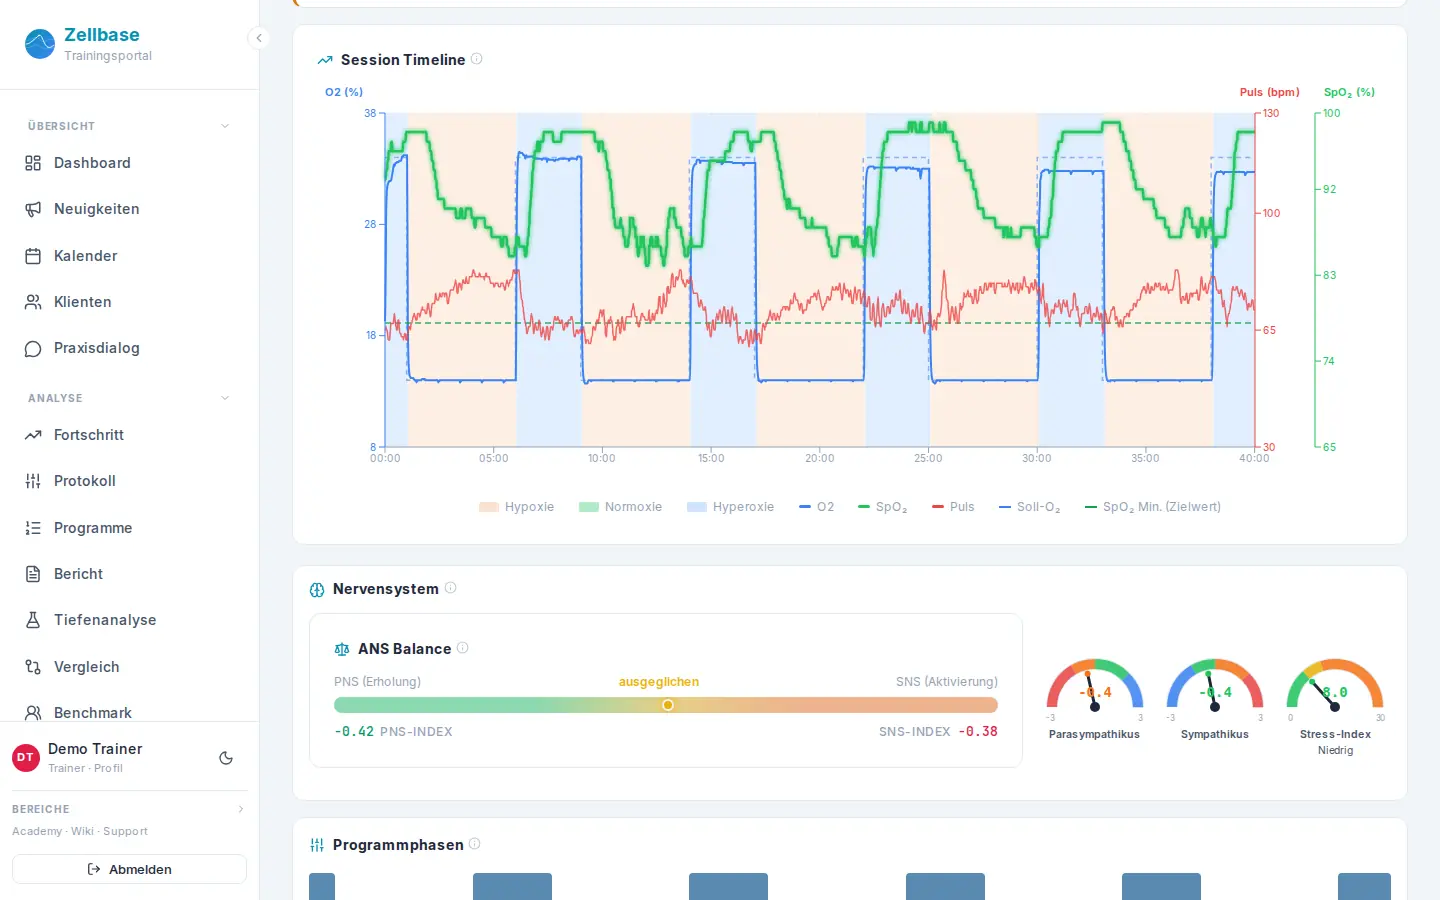
Phases and episodes detected.
Zellbase detects the hypoxia and hyperoxia phases of the programme and the episodes in saturation: how low it went, how long it stayed down and how quickly it recovered afterwards.
- Lowest saturation and programme target
- Duration and share of hypoxia
- Recovery time after every episode
Nervous system
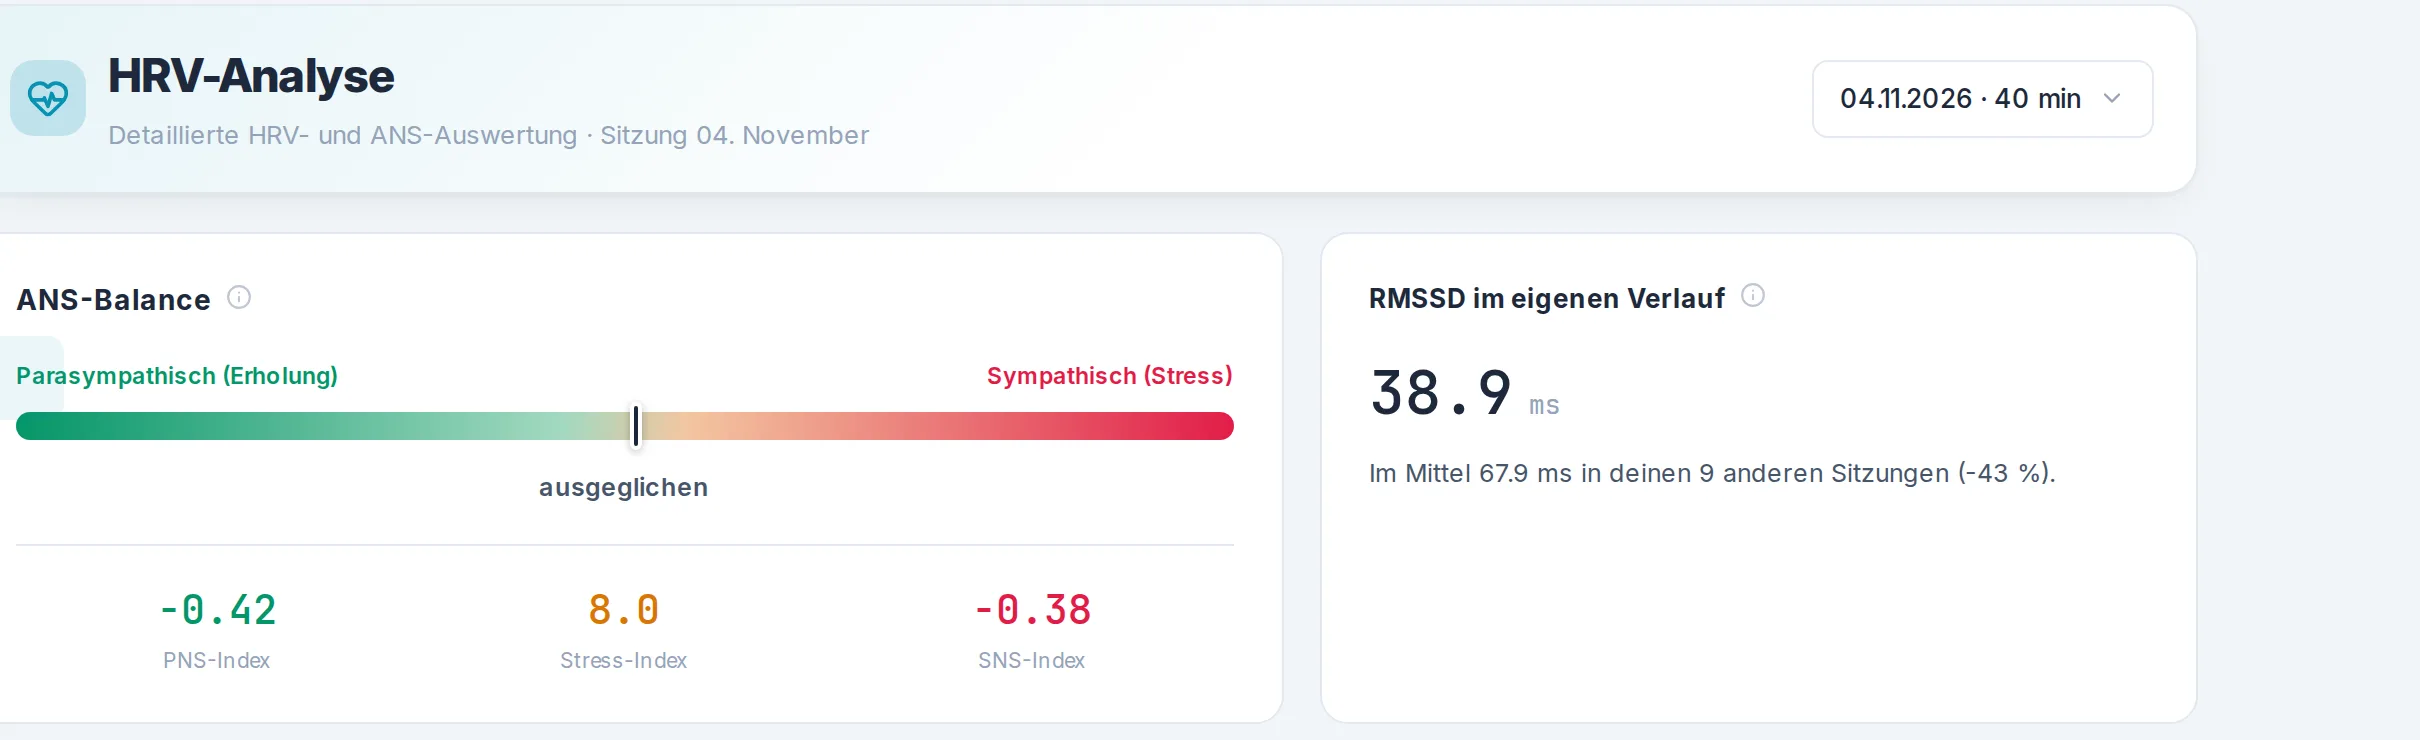
How the nervous system responds.
From the intervals between heartbeats Zellbase calculates how the sympathetic and parasympathetic systems work together during the session, with PNS and SNS index and Baevsky's stress index. The comparison is with the client's own earlier sessions.
Heart rate variability
The methods in detail.
For professionals who want to know exactly: these methods run behind every session. They come from the established literature on heart rate variability.
Time domain
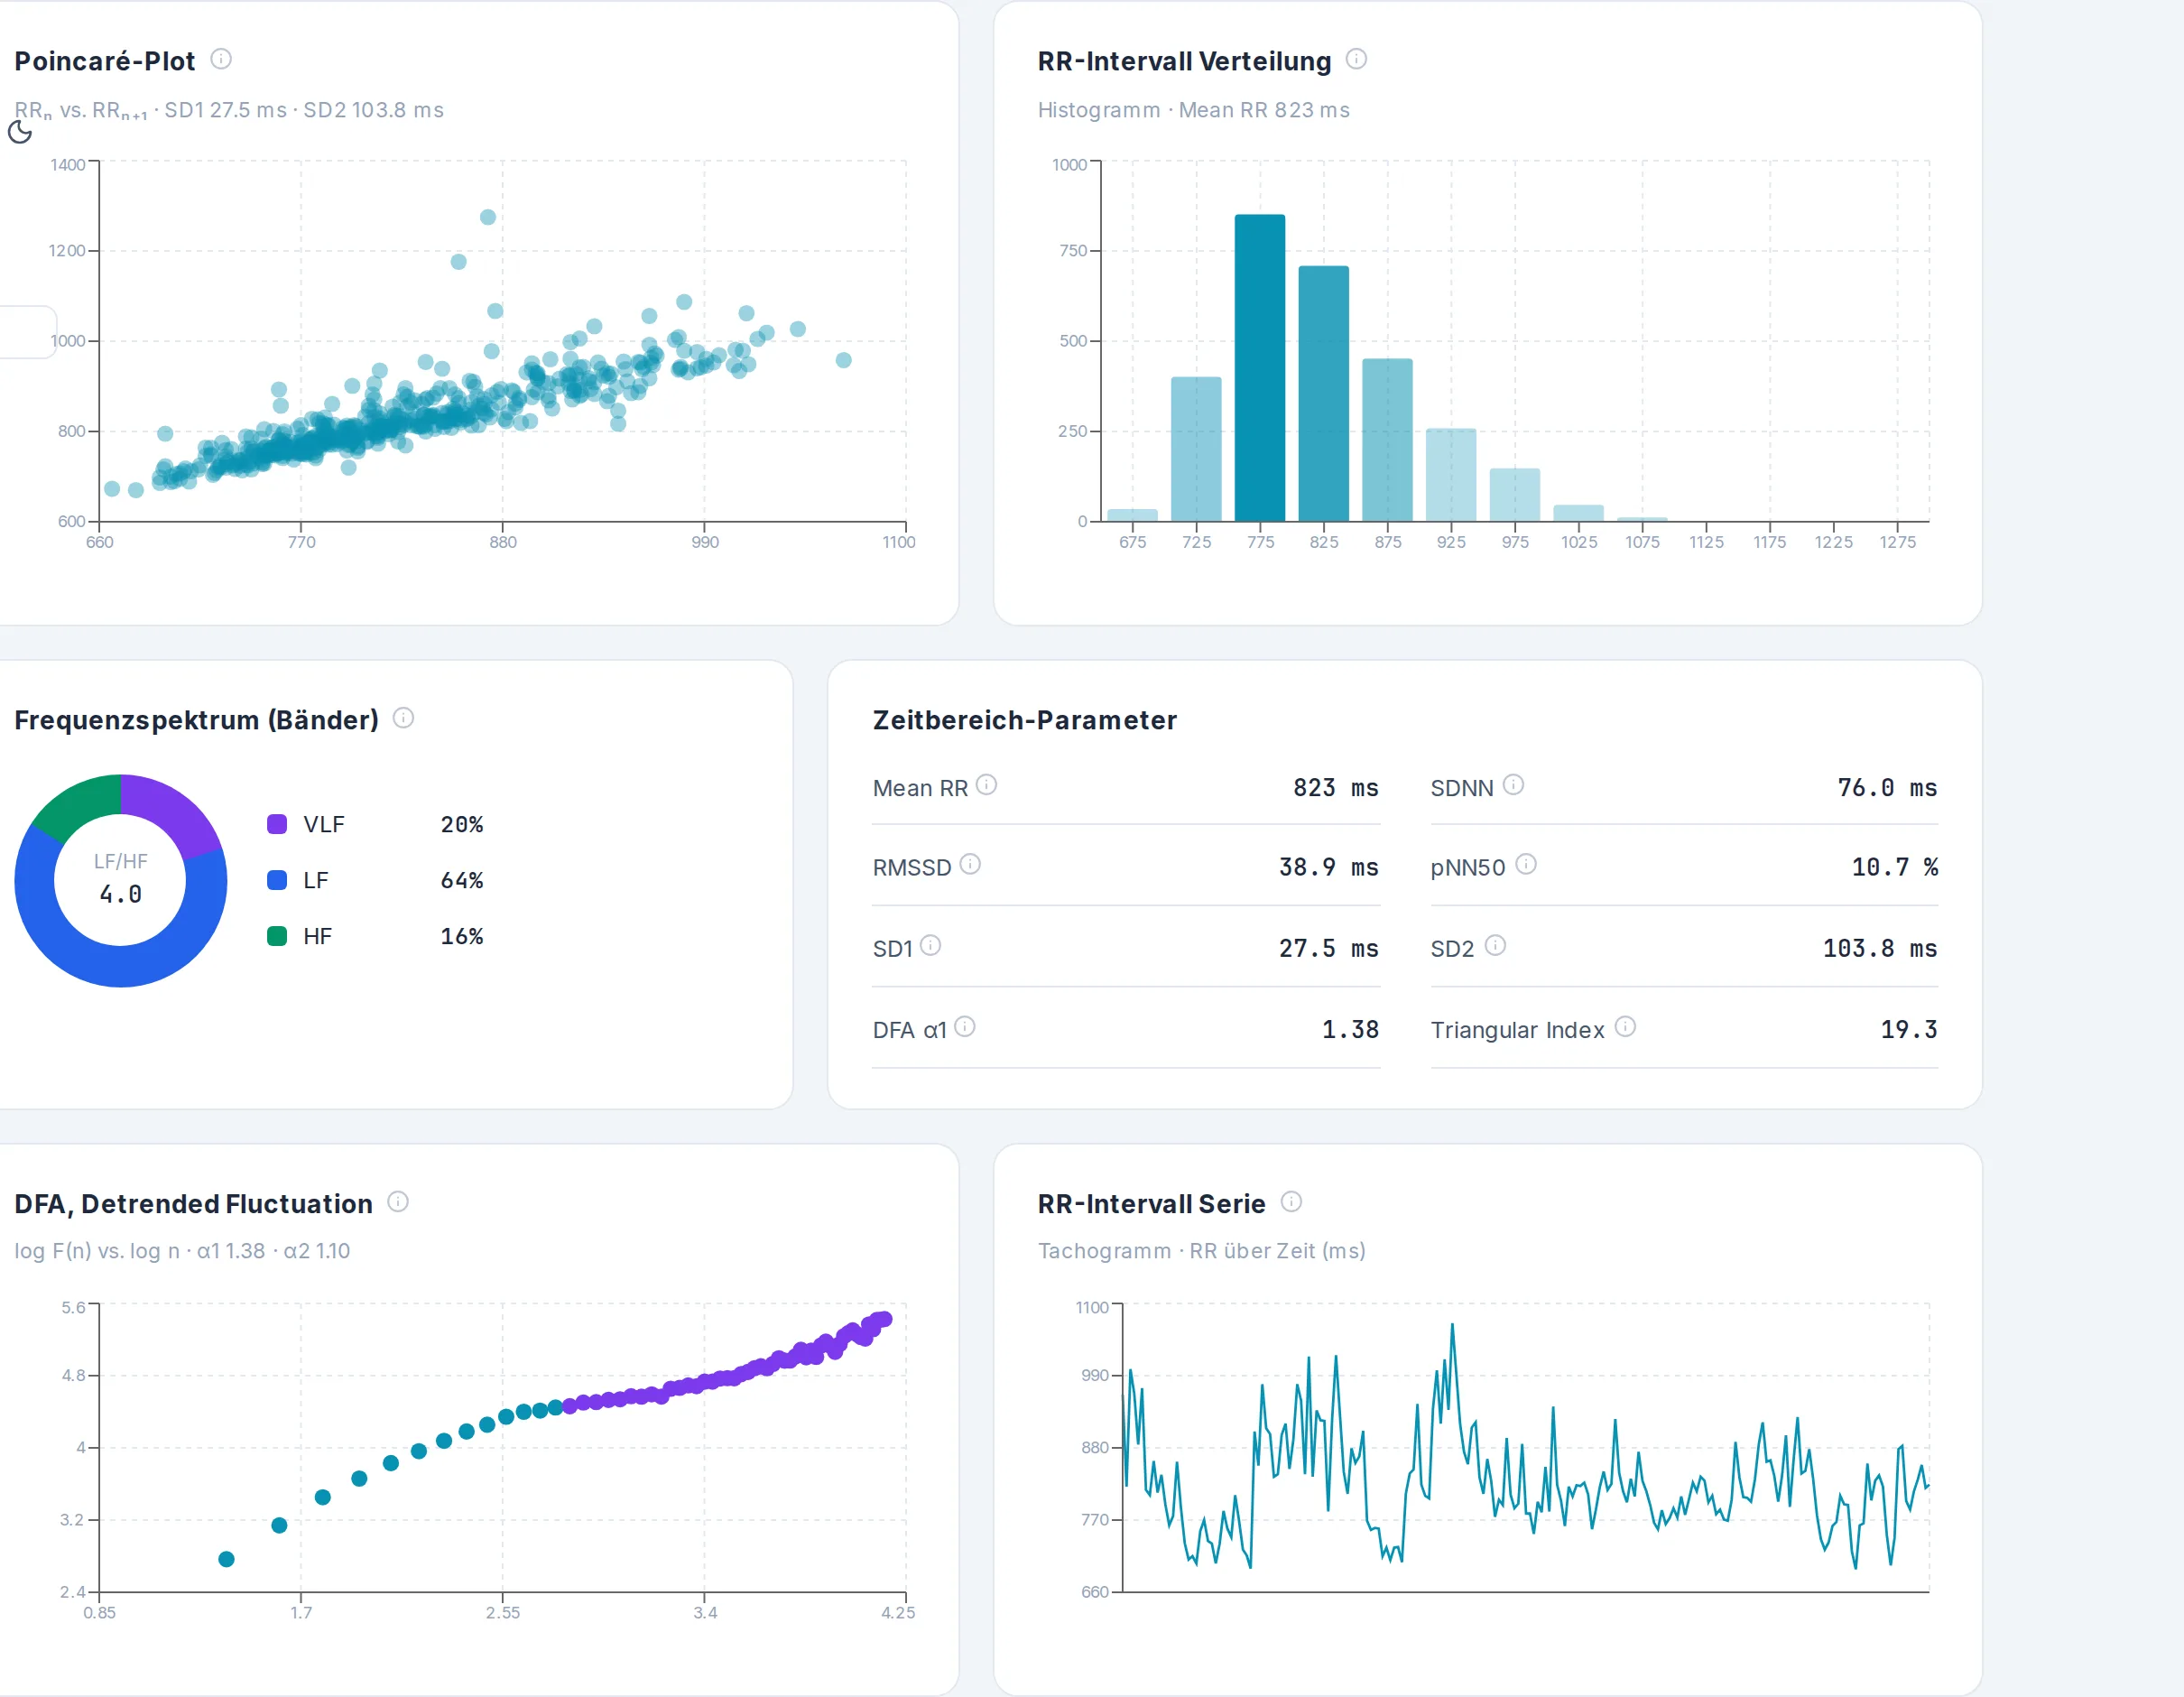
RMSSD, SDNN, pNN50 and mean RR interval describe the variation from beat to beat and across the whole session.
Frequency domain
The Welch spectrum splits variability into the VLF, LF and HF bands and shows their ratio.
DFA α1 und α2
Detrended fluctuation analysis shows how strongly heartbeat intervals relate to each other over short and long stretches.
Poincaré
Each beat plotted against the next: SD1 and SD2 separate short-term from long-term variability.
Clean data
Before calculating, Zellbase filters artefacts and outliers from the RR intervals. Anything that cannot be analysed is marked as such.
Trends
Every figure can be followed across all of a client's sessions, by week and by training block.
Data you can trust.
Our article on data integrity describes why there is more than a number between a reading and the right decision.
Read the article